

FIRE Opportunity Cost Calculator: Purchases in Months to FI
The math behind every FIRE opportunity cost calculator: one formula, a table pricing real purchases in months of delayed FI, and when to ignore the number.


The mental trick FIRE gets right
Most people can tell you what something costs in dollars. Far fewer can tell you what it costs in time.
That is the FIRE (Financial Independence, Retire Early) superpower: it turns spending into a trade between “stuff now” and “freedom sooner.” As Mr. Money Mustache laid out in the shockingly simple math behind early retirement, your savings rate is the dominant driver of how quickly you reach FI — which makes the sharp question not “Can I afford this?” but:
“How many months does this push my FI date back?”
Plenty of sites already offer interactive sliders for this — WalletBurst’s Purchase Impact Calculator is the best one, and we link it again below. What this post adds is the part the sliders hide: the actual math, a table of real purchases priced in months of FI, and the guardrails for when the number should not decide for you.
One tone check before we start: this is not a guilt machine. The goal is clarity. Sometimes the right answer is still “buy it,” because the purchase improves your life, health, or earning power.
The formula behind every FIRE opportunity cost calculator
There are two practical ways to convert a purchase into “months to FI.”
Method 1: The fast mental math
If you invest S per month and you buy something that costs X:
Delay (months, rough) = X / S
It is intentionally blunt — it ignores compounding — but it answers the real question most of the time: “How many extra months of investing does this represent?”
Method 2: The compounding model (what the calculators actually run)
For big purchases you want the version that accounts for growth. With:
- P = current invested portfolio
- C = monthly contribution
- T = FI target (annual spending ÷ SWR; the 4% baseline means T = 25× spending)
- i = monthly real return (annual real return ÷ 12)
Months to reach the target:
n = LN( (C + i×T) / (C + i×P) ) / LN(1 + i)
The cost of a purchase X funded from money you would have invested:
- n0 = months to FI with portfolio P
- n1 = months to FI with portfolio P − X
- Delay = n1 − n0
That formula is spreadsheet-safe: =LN((C + i*T)/(C + i*P))/LN(1+i) in Google Sheets or Excel.
The table: what real purchases cost in months of FI
Here is the formula applied to one realistic profile, two savers:
Shared assumptions: portfolio P = $80,000; annual spending $40,000; 4% SWR so T = $1,000,000; 4% real return; purchase funded from cash that would have been invested. Saver A invests $700/month (FI in ~429 months ≈ 35.8 years). Saver B invests $3,000/month (FI in ~199 months ≈ 16.6 years).
| Purchase | Cost | Saver A ($700/mo): FI delay | Saver B ($3,000/mo): FI delay |
|---|---|---|---|
| New headphones | $200 | 0.2 months (~6 days) | 0.1 months (~2 days) |
| Flagship phone upgrade | $1,200 | 1.2 months | 0.4 months |
| International vacation | $2,000 | 2.1 months | 0.6 months |
| Used-car upgrade | $5,000 | 5.2 months | 1.5 months |
| New-vs-used car premium | $15,000 | 16.0 months | 4.6 months |
| New car | $35,000 | 38.6 months (3.2 years) | 10.9 months |
| Recurring: $180/month habit (daily delivery coffee, unused subscriptions) | $2,160/yr forever | 48.2 months (4 years) | 8.4 months |
Three things jump out of this table:
- The same purchase has a wildly different time price depending on your savings rate. A $2,000 trip costs Saver A two months of freedom and Saver B less than three weeks. Time-cost is personal; never borrow someone else’s number.
- Recurring beats one-time, always. The $180/month habit delays Saver A’s FI by four years — more than the $35,000 car — because it permanently lowers the contribution C instead of denting the portfolio once. Hunt recurring leaks first (here is how founders audit their subscription stack).
- The compounding model is kinder than the mental math. Quick math says the $2,000 trip costs Saver A 2.9 months; the real model says 2.1, because the rest of the portfolio keeps compounding. Use the blunt version for everyday calls and the real one for big buys.
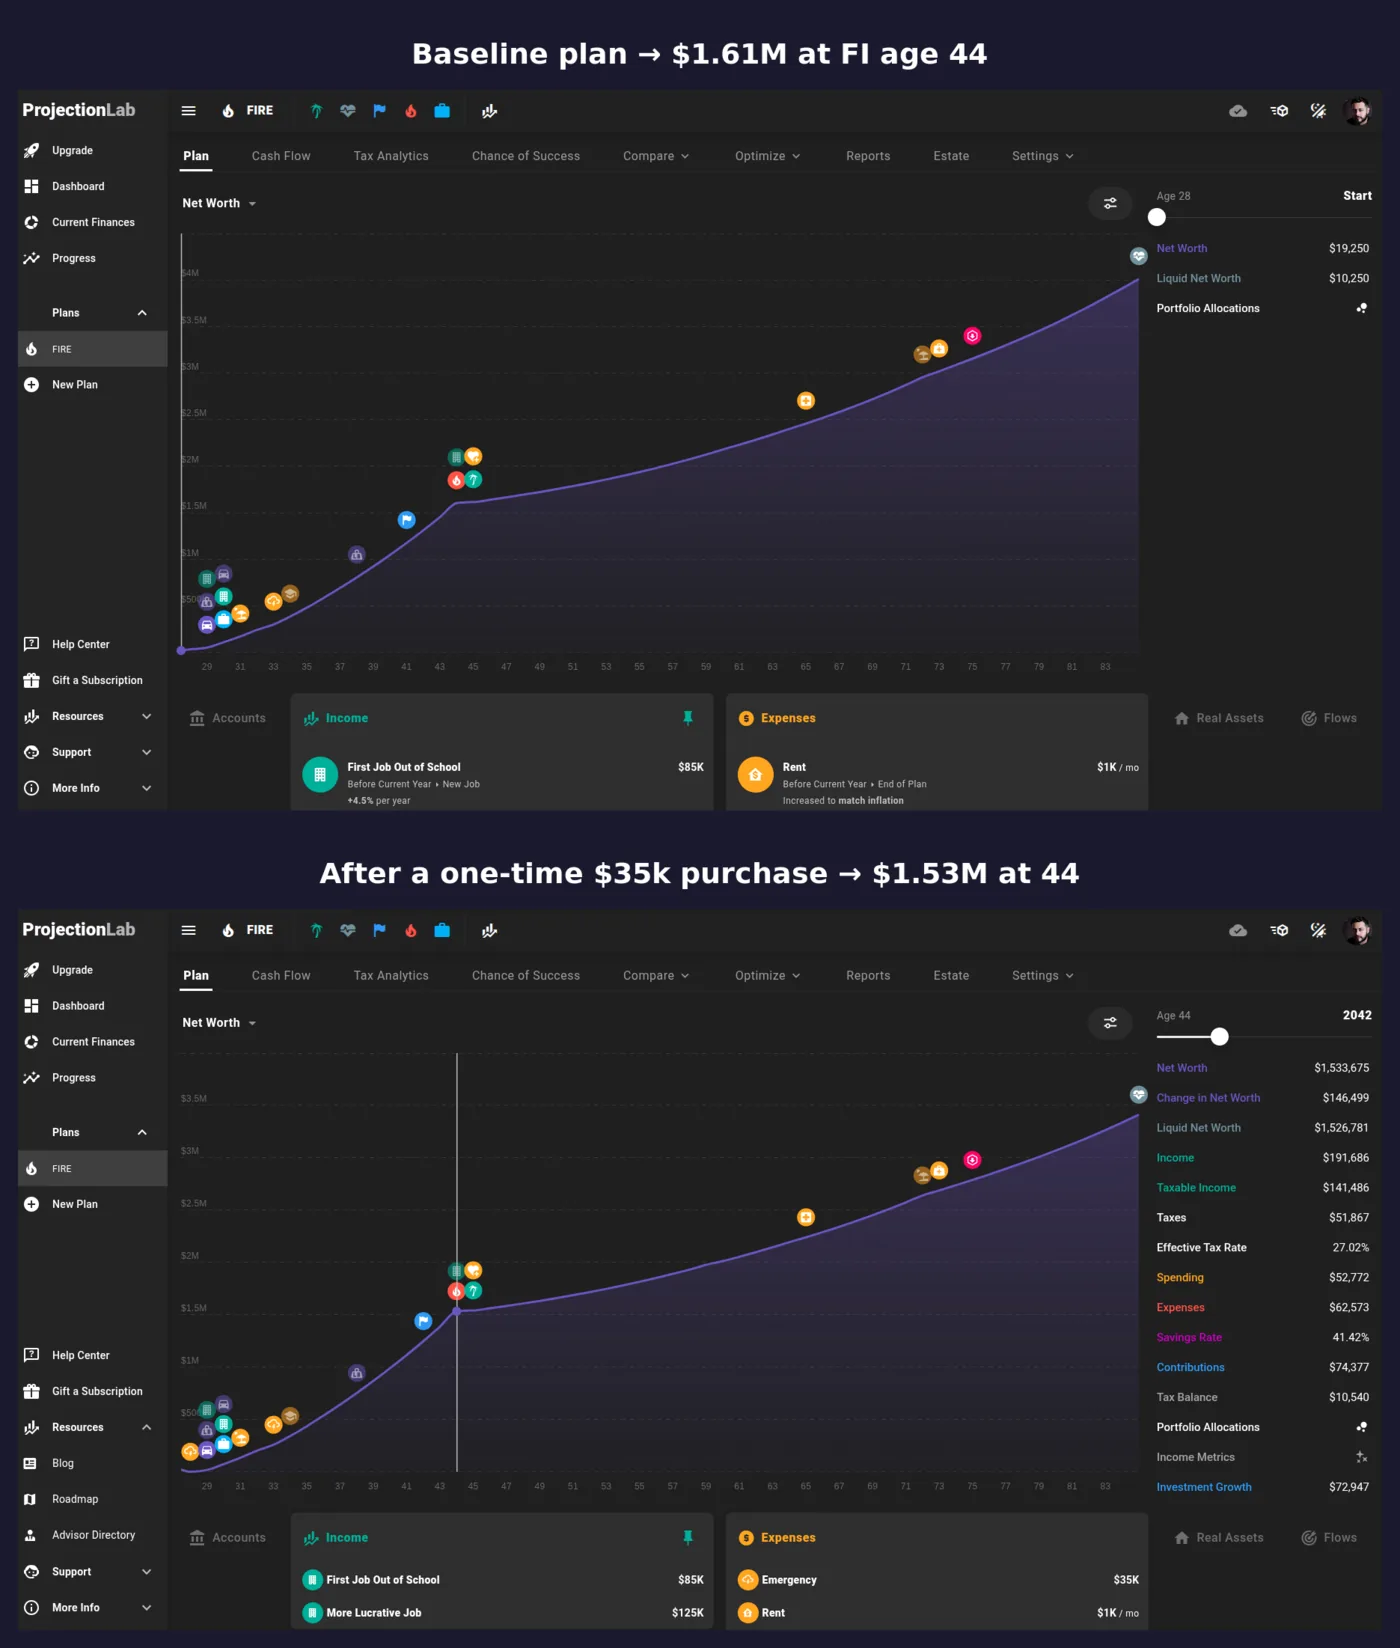
We ran this in ProjectionLab’s sandbox: the baseline plan reaches FI at age 44 with $1,607,181; adding a single one-time $35,000 purchase in year one left the FI age at 44 in this scenario, but net worth at the FI date dropped to $1,533,675 — a roughly $73,500 gap for a $35,000 sticker price, courtesy of the compounding the money never got to do.
Want sliders instead of a spreadsheet? Use WalletBurst
If you would rather drag sliders than paste formulas, WalletBurst’s FIRE Purchase Impact Calculator is the cleanest interactive version of exactly this math — enter your portfolio, contribution, and the purchase, and it charts the timeline shift. The formulas above are what is running under its hood, and knowing them means you can sanity-check any calculator’s output (and adapt the math when your situation does not fit the tool, like lumpy founder income).
For broader scenario testing beyond single purchases, Engaging Data’s FIRE calculator adds historical-sequence and Monte Carlo views.
Early retiree mode: lower SWR, bigger target, bigger delays
The 4% baseline comes from Trinity-study style historical testing over 30-year horizons (background: the Trinity study). Early retirees often stress-test with a lower SWR because their horizon can run 40–60 years:
- Base mode: SWR = 4% → T = 25× annual spending
- Early retiree mode: SWR = 3.5% or 3% → T ≈ 28.6× to 33.3× annual spending
Re-running Saver A’s $2,000 purchase at a 3.5% SWR (T = $1,142,857): delay grows from 2.1 to about 2.3 months. Bigger target, slightly costlier purchases.
Return assumptions move the answer too — same purchase, same saver:
| Scenario | Real return | FI delay ($2,000 purchase, Saver A) |
|---|---|---|
| Conservative | 3% | 2.3 months |
| Base | 4% | 2.1 months |
| Optimistic | 6% | 1.9 months |
The honest answer is a range — “about 2 to 3 months” — not a falsely precise decimal. The calculator is a comparison engine, not a forecast.
Upgrade it: the Quality-of-Life ROI check
Opportunity cost is not only financial. Some purchases buy you health, time, skills, or stability — the same logic that makes the $100k degree-vs-skills opportunity cost a real decision rather than an obvious one.
Give the purchase 1 point for each “yes”:
- Does it save me at least 2 hours per week consistently?
- Does it reduce a recurring pain point that affects my health or work performance?
- Does it increase my earning power within 12 months?
- Does it reduce risk (safety, reliability, avoiding costly emergencies)?
- Would I still be happy I bought it one year from now?
Interpretation:
- 0–1 yes: pure consumption tradeoff — let the FI-delay number lead.
- 2–3 yes: a maybe — look for a cheaper or used version.
- 4–5 yes: probably high-ROI — the FI delay may be worth paying.
Guardrails (so you do not misuse the number)
The 4% rule is a baseline, not a guarantee
Researchers including Scott, Sharpe, and Watson (“The 4% Rule — At What Price?”) have critiqued rigid application of the rule, and Wade Pfau has documented the limits of leaning on historical backtests alone. For your calculator that means: SWR is a knob, not a constant. Stress-test with early-retiree mode.
Sequence-of-returns risk is real
Even if average returns look fine, the order of returns matters, especially near the start of retirement. Prefer ranges and conservative stress tests over a single confident number.
Don’t double-count your assets
If you are a founder, be careful what you put in P. Counting illiquid business equity at face value inflates the portfolio and understates every purchase’s delay — here is how to count business equity in your FI number and whether it belongs in your Coast FIRE math.
How to use the result
- Under 1 month: do not overthink it; focus on habits.
- 1–3 months: pause and compare alternatives (used, smaller, delayed).
- 3+ months: treat as a major decision — run scenarios, apply the Quality-of-Life check, and ask what you are trading away.
The point is not to never spend. The point is to spend on purpose.
Sources
- Mr. Money Mustache — The Shockingly Simple Math Behind Early Retirement. Savings rate as the dominant driver of time-to-FI.
- WalletBurst — FIRE Purchase Impact Calculator. Interactive version of the math in this post.
- Trinity study (Cooley, Hubbard, Walz). Historical testing behind the 3–4% withdrawal baselines (descriptive, not guarantees).
- Scott, Sharpe, Watson — “The 4% Rule – At What Price?” (Stanford). Why a rigid 4% rule hides tradeoffs.
- Wade Pfau — Retirement Withdrawal Rates and Portfolio Success Rates (MPRA working paper). Cautions on historical backtests as forecasts.
- Engaging Data — FIRE calculator. Historical-sequence and Monte Carlo scenario testing.
Keep reading

Can a Non-Coder Actually Ship With Cursor? A Developer’s Honest Test
Cursor is not no-code. Here is what a non-technical founder can realistically ship in weeks — and when you still...

Self-Hosting n8n: The Real Cost vs Cloud (and the 6 hrs/week DevOps Tax)
A founder-facing TCO teardown of n8n Cloud vs self-hosted infra — including the DevOps hours nobody puts in the spreadsheet.

reMarkable vs Boox vs Kindle Scribe: Which One Actually Replaces the Note Vault You Abandoned?
An honest, spec-and-review-based comparison of reMarkable, Boox, and Kindle Scribe for anyone who quit Obsidian or Notion and wants notes...

6 Books That Actually Changed How I Run a One-Person Business (2026)
Not a top-20 listicle. Six books I actually read and applied while running a one-person AI business, and the one...

Do Phone Lock Boxes Actually Work for Founder Focus? The Commitment-Device Case
A clear-eyed look at whether phone lock boxes help a one-person founder focus — grounded in commitment-device research, with free...

The ‘Second Brain’ is Over: Why You Need a Second Executioner
Stop hoarding notes and start shipping. Discover why the Second Brain fails and how the Second Executioner model uses Personal...
You've reached the end — no more posts to load.
No comments yet — be the first to share your thoughts.